 volver
al índice de tablas
volver
al índice de tablas| Accidentes de trabajo con baja en 2011 |
 volver
al índice de tablas volver
al índice de tablas |
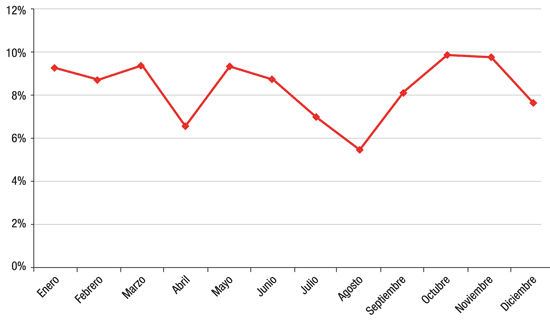
| Accidentes in itínere según gravedad de la lesión por mes de la baja | ||||||
| Leve | Grave | Mortal | Total | |||
| Enero | Recuento | 1.278 | 15 | 4 | 1.297 | |
| % sobre el total | 9,3% | 16,3% | 13,3% | 9,3% | ||
| Febrero | Recuento | 1.201 | 6 | 5 | 1.212 | |
| % sobre el total | 8,7% | 6,5% | 16,7% | 8,7% | ||
| Marzo | Recuento | 1.295 | 8 | 1 | 1.304 | |
| % sobre el total | 9,4% | 8,7% | 3,3% | 9,4% | ||
| Abril | Recuento | 901 | 8 | 2 | 911 | |
| % sobre el total | 6,5% | 8,7% | 6,7% | 6,6% | ||
| Mayo | Recuento | 1.285 | 7 | 1 | 1.293 | |
| % sobre el total | 9,3% | 7,6% | 3,3% | 9,3% | ||
| Junio | Recuento | 1.199 | 10 | 0 | 1.209 | |
| % sobre el total | 8,7% | 10,9% | 0,0% | 8,7% | ||
| Julio | Recuento | 969 | 4 | 3 | 976 | |
| % sobre el total | 7,0% | 4,3% | 10,0% | 7,0% | ||
| Agosto | Recuento | 765 | 3 | 2 | 770 | |
| % sobre el total | 5,6% | 3,3% | 6,7% | 5,5% | ||
| Septiembre | Recuento | 1.122 | 6 | 2 | 1.130 | |
| % sobre el total | 8,1% | 6,5% | 6,7% | 8,1% | ||
| Octubre | Recuento | 1.359 | 8 | 2 | 1.369 | |
| % sobre el total | 9,9% | 8,7% | 6,7% | 9,9% | ||
| Noviembre | Recuento | 1.351 | 6 | 5 | 1.362 | |
| % sobre el total | 9,8% | 6,5% | 16,7% | 9,8% | ||
| Diciembre | Recuento | 1.048 | 11 | 3 | 1.062 | |
| % sobre el total | 7,6% | 12,0% | 10,0% | 7,6% | ||
| Total | Recuento | 13.773 | 92 | 30 | 13.895 | |
| % sobre el total | 100,0% | 100,0% | 100,0% | 100,0% | ||
| Fuente: IRSST | ||||||
Distribución del total de accidentes in itínere por mes de la baja
